Renewal of The Existing Housing Stock Depends on Home Sales
This content was first published on BuildZoom.com on February 22, 2017.
On average from 2010 to 2015, every 3 existing home sales generated construction activity in 1 additional home.
Even though people routinely care for their homes, the turnover of homes between owners is vital in keeping the housing stock up to date.
The up-front cost of deferred maintenance and renovation when buying a home is likely to be greater, and affect first-time buyers more, after periods of low existing home sales.
Existing home sales often generate construction activity. When sellers address deferred maintenance and renovation before putting homes on the market, or when buyers do so after purchasing a home, the result is a burst of construction activity that wouldn’t have happened otherwise (or would have been delayed, often indefinitely).
Data on building permits and home sales – the latter courtesy of Trulia – suggest that home sales’ role in driving remodeling and maintenance is substantial. In the City of Atlanta, for example, the probability of observing permitted work on a home from 2010 to 2014 was almost 3 times higher than normal during the year after a home was bought, and was more than 4.5 times higher than normal during the first three months (see Methodology below for details). The probability was also elevated just before homes were sold, but not nearly as much as after the sale.


A similar pattern emerged in all other cities in our analysis, including Los Angeles and Phoenix, shown alongside Atlanta. The overall probability of remodeling and maintenance in existing homes in Atlanta is between that of Phoenix and Los Angeles because the housing stock in Atlanta tends to be older than in Phoenix and newer than in Los Angeles.

The share of permitted work occurring within a year before or after a sale has fluctuated over time, but only to a limited extent. In Phoenix, for example, the share ranged from a high of 40.3% in 2005, during the housing boom, to a low of 25.3% in 2008. The share exhibited a pro-cyclical pattern in all of the observed cities, i.e. it rose during the housing boom, decreased during the bust and has been slowly rising since. However, as the chart shows, the extent of fluctuation over time has been limited, and it is a reasonable approximation to say that typically about a third of remodeling and maintenance occurs within a year before or after a sale. The other cities exhibited a similar pattern over time.

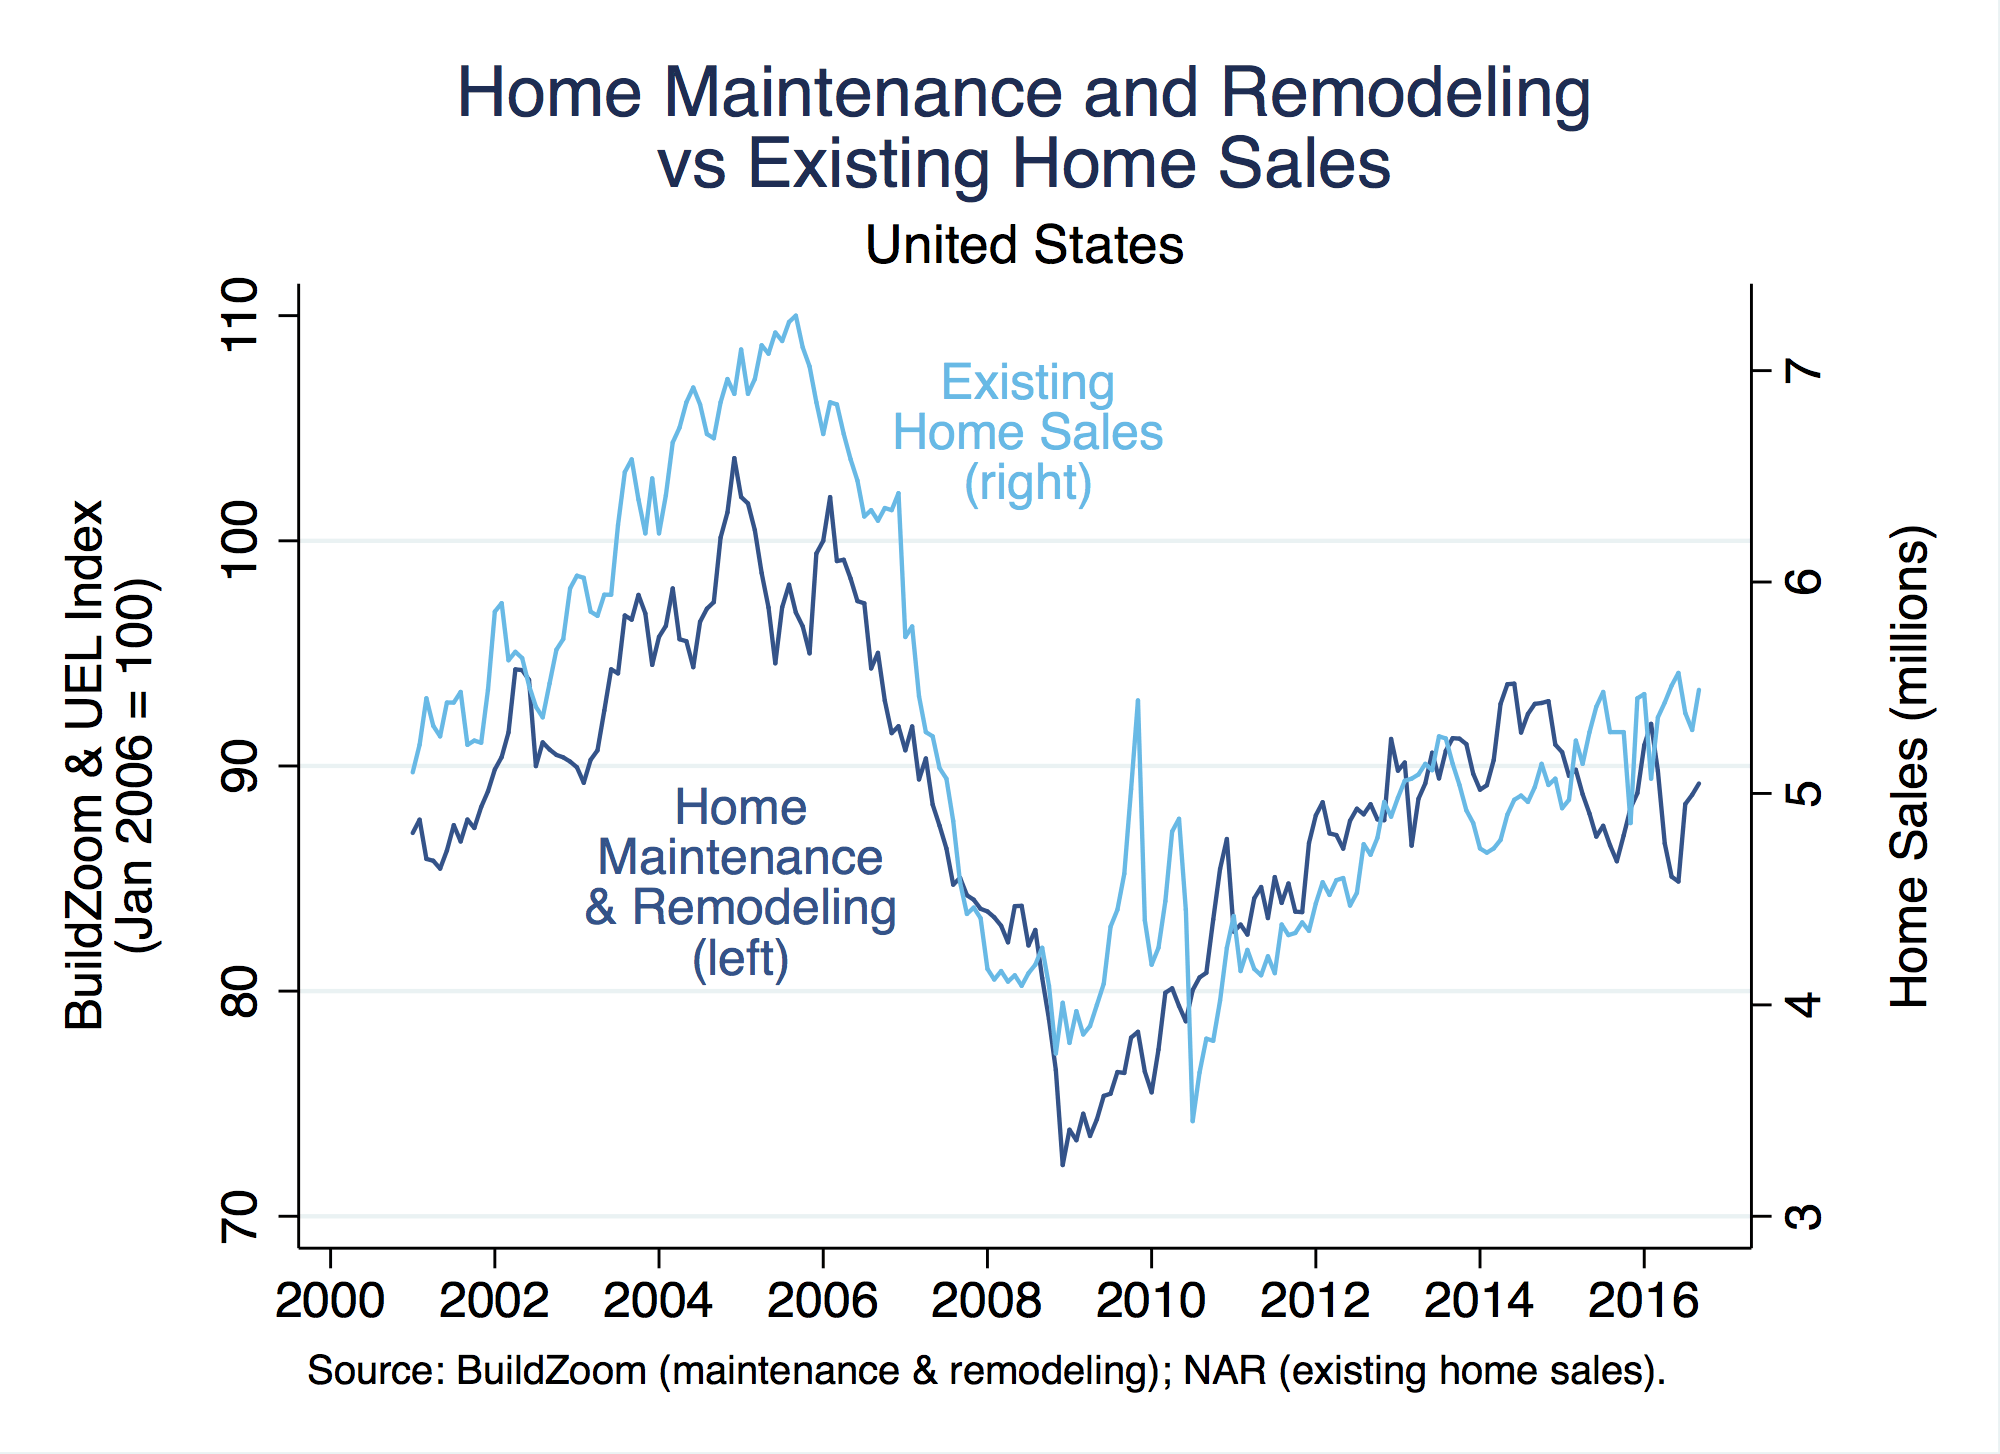
At the national level, residential remodeling and maintenance are positively correlated with existing home sales. The next chart plots the number of existing home sales against the BuildZoom & Urban Economics Lab Index, which tracks residential remodeling and maintenance activity. Of course, the correlation on its own does not imply causation. For instance, if people’s prospects were brighter before the Great Recession and, as a result, they were more willing and able to take on debt, this could have led to the higher levels that we see of both home sales and remodeling, even if the former wasn’t actually driving the latter. However, juxtaposing the chart with the earlier evidence regarding the timing of remodeling and maintenance vis-a-vis sales leaves little room for doubt that home sales were, in fact, responsible for generating some amount of construction activity.
The remaining question is how much permitted work do existing home sales generate? The earlier analysis of timing vis-a-vis home sales suggests that, on average, every additional existing home sale generated permitted work on approximately 0.25 existing homes in Atlanta, 0.32 homes in Los Angeles and 0.09 homes in Phoenix (see Methodology below for details).
Similar results emerge from a separate analysis of data on building permits and home sales at the zip code level in the top 50 US metro areas – the latter type of data courtesy of CoreLogic. Using econometric techniques to crudely disentangle correlation from causation we estimate that nationally, from 2010 to 2015, every additional existing home sale generated permitted work on approximately 0.33 existing homes on average, i.e. every 3 existing home sales generated construction activity in one additional home (See Regression Appendix below for details). This estimate is higher than the city-specific ones coming from the analysis of timing vis-a-vis home sales, but it is in the same ballpark.
Implications
Overall, the evidence suggests the share of home maintenance and remodeling driven by existing home sales is substantial, but what are the implications? These activities prevent the existing housing stock from deteriorating and keep it functionally and stylistically up to date. If one thinks of them as capturing the pace at which the housing stock is maintained and updated, it becomes clear that when the volume of existing home sales is low, the upkeep of the existing housing stock suffers, and vice versa.
Another implication is that the up-front cost of buying a new home – which implicitly includes the costs of deferred maintenance and renovation – is higher after prolonged periods of below-normal transaction volume. This applies in the present and is unfortunate given the generational nature of the current housing affordability crisis because it is bound to affect first-time buyers more than repeat buyers. Whereas repeat buyers can apply equity accrued in their old home to up-front costs like a down payment or deferred maintenance and renovation, first-timers cannot.
A recent NAHB update showed that over the past decade or so the US housing stock has aged more quickly than usual and, as I have explained before, this largely reflects the statistical effect of the dearth of new construction. However, if the upkeep of the housing stock suffers when existing home sales are low then the housing stock is not just aging faster in a statistical sense, it is also physically growing more shabby.
Methodology
The analysis of the timing of existing home maintenance and remodeling vis-a-vis home sales uses building permit data from BuildZoom, matched with property records and sale transaction data from Trulia (i.e. data were provided by Zillow Group Inc. and its affiliated entity, Trulia. The results and opinions herein are those of the author and do not reflect the position of Zillow Group Inc.). The latter are limited to single-family homes and to arm’s length transactions. In each city, the matched sample is limited to properties successfully matched by address across the data sets.
The probability of permitted home maintenance or remodeling is estimated using a linear regression. In each city, the sample consists of an observation for every (matched) property in the city each month from January 2010 through December 2014. The dependent variable is an indicator that equals one if one or more building permits were associated with the property that month and zero otherwise. The independent variables are a set of indicators for timing vis-a-vis the temporally closest arm’s length sale, ranging from 12 months before sale through 12 months after the sale, and a constant term capturing the monthly probability outside this time frame. The dependent variable excludes permits associated with new construction or occurring within 12 months after a new construction permit on the same property. The dependent variable also excludes permits associated with flipping, defined as intervals of up to 12 months between consecutive sales. As we observe only arm’s length sales, building permits associated with flips that couple a purchase by distressed sale with a subsequent arm’s length sale are not excluded, and appear in the data as contributing to home maintenance and remodeling before a sale. The chart showing the share of home maintenance and remodeling occurring within a year before or after sale over time in Phoenix, AZ, includes flips in this share (their contribution is small and does not drive the observed pattern).
The multipliers estimating the elevated probability of observing permitted work were obtaining by taking the average monthly probability in the relevant period, e.g. 3 months following a sale, and dividing it by the monthly probability when there is no arm’s length sale within 12 months before or after the observed month (this probability is captured by the constant term). The city-specific estimates of the amount of permitted work generated by each additional existing home sale were obtained by (i) taking the annual probability of home maintenance or remodeling when there is no arm’s length sale within 12 months, (ii) multiplying it by the estimated multiplier for the 12 months after a sale, and (iii) subtracting the probability in (i). For example, in the City of Los Angeles, the annual probability of home maintenance or remodeling when there is no arm’s length sale within 12 months is roughly 8.8% and the probability of observing such activity within 12 months after a sale is about 4.6 times higher than that. Because 0.088 x (4.6 – 1) = 0.317 we reported that, on average, every additional existing home sale generated permitted work on approximately 0.32 existing homes in Los Angeles. Note that the period analyzed runs through the end of 2014 in order to allow a 12 month period to observe subsequent arm’s length sales (the data run through the end of 2015 in earnest). Also, note that all of the estimates include the month of sale, i.e. the 3 (12) months before (after) sale actually reflect a 4 (13) month period containing the 3 (12) months strictly before (after) the sale, as well as the month of sale.
Regression Appendix
We estimated the effect of existing home sales on home remodeling and maintenance in a series of multivariate linear regressions. The data used consist of annual observations at the zip code level from 2010 to 2015 for zip code areas in the top 50 largest metro areas for which BuildZoom has obtained building permit data (BuildZoom’s national building permit database currently covers over 40 percent of the U.S. population). The dependent variable in all regressions is the number of properties with observed residential permitted work, obtained from BuildZoom’s building permit database, and excluding work classified as new construction or occurring within 12 months of a new construction permit on the same property. The independent variable of interest is the number of existing home sales, obtained from CoreLogic. In what follows, we refer to an existing home undergoing construction activity succinctly as “a remodel” regardless of whether the work actually involves remodeling or maintenance.

Column (1) indicates that, unconditionally, an additional existing home sale is associated with 0.95 additional “remodels” on average.
To account for zip code areas’ scale, i.e. so the estimate does not reflect the fact that zip codes with more homes experience more resales and more “remodels,” we controlled for the number of housing units, obtained from the 2010-2014 5-year ACS. Column (2) shows that, conditional on the number of housing units, an additional existing home sale is associated with 0.66 additional “remodels” on average.
Cyclicality in the housing market may also bias the estimates. When the housing market is booming, for example, people are likely to be more willing and able to take on new debt, bear more children and form (or split) households, which can drive both existing home sales and “remodels.” To account for housing market cyclicality we controlled for the annual percent change in the zip code level housing price index (HPI), obtained from the FHFA. Column (3) shows that, conditional on the expanded set of controls, an additional existing home sale is associated with 0.62 additional “remodels” on average.
Columns (4) and (5) control, in addition, for the number of new home sales and the number of distressed home sales (short sales and REO sales), obtained from CoreLogic. They both report that an additional existing home sale is associated with 0.73 additional “remodels” on average. The increase in the estimate from Column (3) to Column (4) is consistent with the notion that new homes are substitutes for existing home maintenance and remodeling (to see this, note that in Column (3) new home sales are an omitted variable, and that the higher estimate in Column (4) in which new home sales are explicitly included reveals that, conditional on the other controls, the number of new home sales is negatively correlated with “remodels”).
Column (6) controls for the nature of different zip code areas more comprehensively by including a set of zip code area fixed effects. This control accounts for differences between zip code areas that go beyond their scale, such as the age and nature of their real estate stock, their residents’ socio-economic makeup, and so forth. Column (6) shows that, conditional on this control as well, an additional existing home sale is associated with just 0.34 additional “remodels” on average.
Column (7) accounts for housing market cyclicality more comprehensively by controlling for metro area-specific time effects. This last control does not substantially change the estimate. Conditional it, an additional existing home sale is associated with just 0.33 additional “remodels” on average.
Even the final estimate in Column (7) does not account for every possible source of bias, e.g. the number of housing units is endogenous inasmuch as the new home construction it reflects and home remodeling are driven by a similar set of factors that may be persistent over time. However, we believe that Column (7) accounts for the bulk of any potential bias and that the estimate therein is close to the magnitude of the causal effect of existing home sales on “remodels.”
As mentioned in the main text, the analysis of the timing of permitted work vis-a-vis home sales strongly suggests that the nature of the relationship between existing home sales and “remodels” is causal. The regression analysis presented here is necessary primarily for estimating the magnitude of the relationship, as opposed to its causal nature, and for providing a national perspective.