The HOPE Tool: Housing, Occupations, People and Economics
The HOPE Tool is a rich data set on Housing, Occupations, People and Economics for the State of California. The data spans the year 2000 as well as the foreclosure crisis (2006-2010) and the recent pre-pandemic past (2015-2019), and emphasizes local housing affordability across the income spectrum and across the range of occupations.
The HOPE Tool makes it easier and quicker for researchers and analysts to investigate the state of housing within the frameworks used in the policy sphere: AMI band, occupations, state assembly and senate districts, and regions. More broadly, the tool provides users with information that would otherwise require substantial time and effort to obtain, right at their fingertips.
The tool aggregates only publicly-available data from the US Census, HUD, ONet, Zillow and the NBER, and we are proud to share it back with the public as a free resource. Development of the HOPE Tool was funded by the Housing Initiative at Facebook.
-
The HOPE Tool was designed to address a broad set of unanticipated questions. The available selection of “cuts” makes the Tool particularly well-suited to tackle questions involving AMI bands, and occupations.
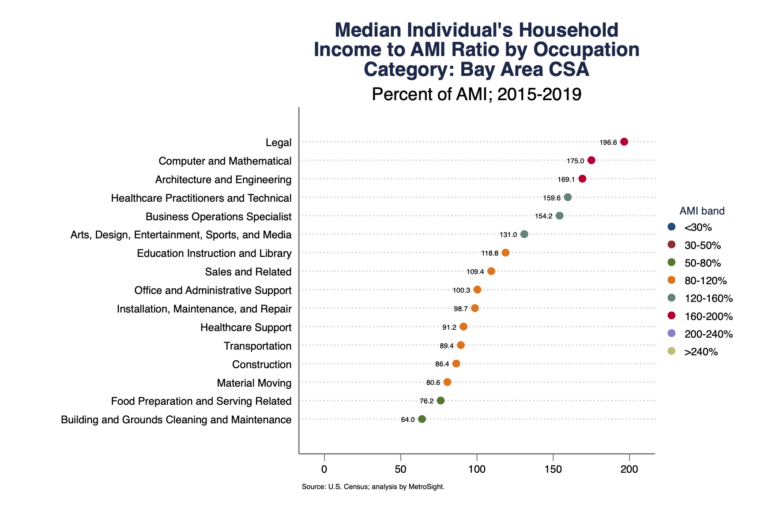
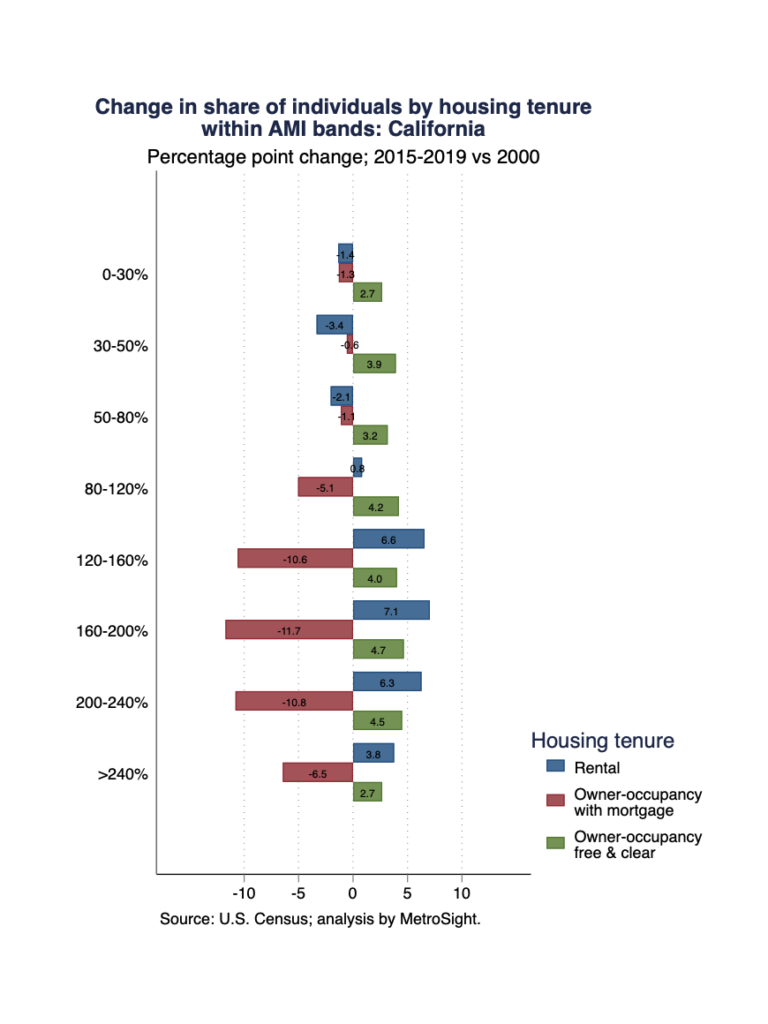
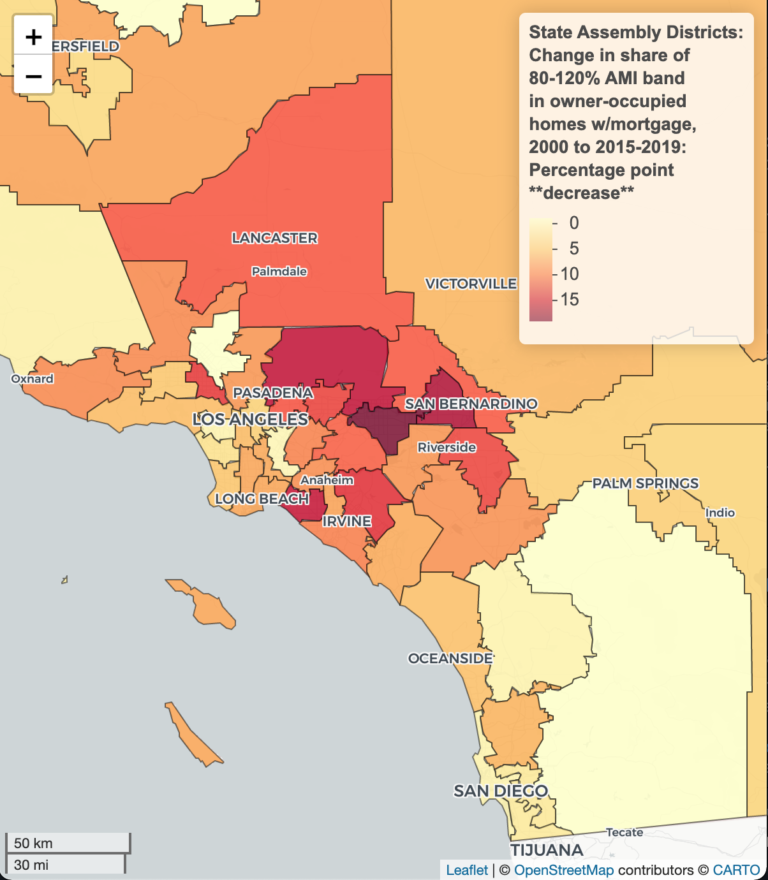
The visuals on this page provide examples of what can be done with the tool.
In addition, here are examples of questions that could be answered using the HOPE Tool:
What is the correspondence between occupations and AMI bands? Which AMI band has the greatest share of teachers?
Are affordability concerns limited to the large coastal metros?
Where are certain occupations over- and under-represented, and how does that relate to housing affordability? Pre-pandemic, was the picture mirrored by super-commuting?
Which groups of people own their homes free and clear? Do those groups skew towards certain ages, or races and ethnicities?
Has the number or share of people who own their home with a mortgage decreased in recent years? Has that group become more or less affluent?
Where and in what groups is multi-generational living most common?
Who actually lives in missing-middle housing?
-
Suppose a researcher is interested in measures of housing affordability for school teachers across California.
The Census publishes a large but ultimately limited set of aggregate statistics, very few of which break down their subject matter by occupations, let alone very granular ones. As an alternative, the Census produces public-use micro-data samples (PUMS) that allow one to independently compile a much richer set of aggregate statistics. The trade-off is two-fold: First, in exchange for granularity, PUMS data protect people’s privacy by reporting their location of residence only in terms of a broad Public-Use Micro-data Area (PUMA) of around 100k residents; Second, while aggregate statistics from the Census can be looked up and used right away, PUMS data require careful manipulation–not rocket science, but detail-oriented and time-consuming work nonetheless.
The HOPE Tool, at its core, saves researchers and analysts time and effort by compiling from Census micro-data a rich set of over 600 aggregate statistics spanning housing, income, affordability, demographics, and more. It does so for a multitude of population subsets (called “cuts”) and geographical units for which aggregate Census statistics are generally unavailable, and micro-data is the only option. For example, the HOPE Tool reports statistics for over 450 granular occupations as well as their intersection with AMI bands–the occupation x AMI band “cut”–so one could easily look up, say, measures of housing cost burden for teachers in the 80-120% AMI band. Moreover, the Tool does so for a range of geographic units and for three time periods, so one could look up those measures for teachers in the 80-120% AMI band living specifically in the City of Fremont, northeast of San Jose, for example, and even see how they changed between different periods.
The HOPE Tool’s selection of geographic units ranges from the state in its entirety, down to some smaller ones such as state assembly and senate districts. The smaller geographic units tend to arbitrarily overlap with the PUMAs observed in Census micro-data. In those cases, the HOPE Tool uses spatial information on the geographical overlaps and the population residing in them to appropriately weight observations in the micro-data and approximate aggregate statistics for those smaller geographies.
In other cases, the HOPE Tool reports statistics which draw on data beyond the Census. AMI bands are a key example, as they rely depend on income limits defined by HUD for low income, very low income and extremely low-income groups. Other examples include affordability and cost-burden measures that rely on home value and rent data from Zillow, and measures of occupations’ required degree of training, their potential for remote work, or their degree of physical proximity.
In summary, the HOPE Tool provides researchers and analysts with all of the above, prepared and ready to use, so they can proceed straight to making maps and charts and drawing insights.
-
The HOPE Tool consists of 27 files, spanning 3 time periods and 9 types of geographical unit.
The files can be downloaded individually, or in one joint zip file which is quite large (~6GB).
Each file contains information on all the different cuts of the data, once for each geographical unit. For example, one of the simplest cuts simply partitions the population into 8 AMI bands. The file containing data for California counties from the year 2000 will include 8 rows per county which correspond to the cut by AMI bands. It will also include many more rows per county for other cuts (e.g. the AMI band x occupation cut includes 8 x 458 = 3,664 rows per county).
The full list of time periods, geography types and cuts is as follows.
The data currently span 3 time periods:
2000 (Decennial Census)
2006-2010 (5yr ACS)
2015-2019 (5yr ACS)
x 9 types of geography (334 distinct geographic areas):
The entire state of California
Broad regions (8, e.g. ABAG)
Narrow regions (13, e.g. SCAG Coast)
CSAs (broadly-defined metros, e.g. the 12-county San Francisco Bay Area)
CBSAs (narrowly-defined metro areas, e.g. the San Jose metro area)
Counties
State Senate Districts
State Assembly Districts
Cities (122 of them)
x 38 types of data cut (about 10.5k distinct cuts, e.g. registered nurses in the 80-120% AMI band):
Everyone
By AMI band (8 bands)
By occupation (458 IPUMS occ2010 categories)
By occupation “Level 1” groupings (7, derived from IPUMS’ codebook)
By occupation “Level 2” groupings (28, same)
By AMI band x occupation
By AMI band x occupation “Level 1” groupings
By AMI band x occupation “Level 2” groupings
By job zone category (5)
By job zone category x occupation
By job zone category x occupation “Level 1” groupings
By job zone category x occupation “Level 2” groupings
By industry (225 IPUMS ind1990 categories)
By industry “Level 1” groupings (15, derived from IPUMS’ codebook)
By industry “Level 2” groupings (115, same)
By industry “Level 3” groupings (172, same)
By AMI band x industry
By AMI band x industry “Level 1” groupings
By AMI band x industry “Level 2” groupings
By AMI band x industry “Level 3” groupings
By education level
By AMI band x education level
By race/ethnicity
By AMI band x race/ethnicity
By sex
By AMI band x sex
By age group
By AMI band x age group
By housing tenure (incl. owner-occupancy with and without a mortgage)
By AMI band x housing tenure
By units in structure
By AMI band x units in structure
By housing tenure x units in structure
By AMI band x housing tenure x units in structure
By year built
By AMI band x year built
By housing tenure x year built
By AMI band x housing tenure x year built
x 632 variables for each period x geo x cut cell.
-
Using the data for any specific inquiry will usually only require several rows of data from one of the files.
The first step in using the data will typically be identifying the relevant file or set of files. E.g. if one is analyzing counties select a file corresponding to counties for the relevant period, and if one is analyzing changes in counties over time, select county files from all relevant periods.
The second step will typically be selecting rows of interest for each file. For example, if the topic is changes over time in the distribution of households across AMI bands, then the only rows corresponding to the AMI band cut are necessary (and perhaps also the trivial “All” cut which can provide a denominator for obtaining AMI bands’ population shares).
The third step, which may not always be necessary, will typically involve some manipulation of the data, e.g. converting numbers of individuals or households to shares using a relevant total, or taking differences over time across rows from different time periods, and so forth.
The fourth and final step will typically involve reporting results in a table, a chart, or a map. The benefit of the HOPE Tool is that you can get to this step fairly quickly, and focus your creative energy here.
Note that there is often more than one way to get the same information. Suppose for example that we are interested in the racial composition of different AMI bands. One way of obtaining that information is by turning to the AMI band x race/ethnicity cut of the data, and using the numbers of individuals or households. Another way is to turn to the AMI band cut and refer to the specific variables that record the number of individuals or households by race/ethnicity. Yet another way is to turn to the race/ethnicity cut and refer to the variables that record the number of individuals or households by AMI band. All three ways should yield the same information.
-
The HOPE Tool includes a data dictionary that is more comprehensive than just a list of variable names and descriptions. The entries will generally include salient information about how the variables were generated and/or where the information was drawn from.
In addition, the data dictionary contains notes that cover important aspects of the data construction, such as suppression of geographic units with insufficient approximation metrics, as well as comprehensive lists of the different geographic units and their make-up, the different cuts, and the different levels of occupation and industry groupings (different levels of granularity).
Finally, for cases in which the data dictionary does not suffice, the code used to create the HOPE Tool can be made available upon request.
-
Yes!
While the HOPE Tool itself is intended for technical users who can take advantage of statistical packages, you can find below an initial selection of Excel files derived from the HOPE Tool, which are accessible to non-technical users.
Our hope is that users of the HOPE Tool will, over time, contribute such files stemming from their own work back to the public by sharing with us, so we can post them here.
-
The HOPE Tool derives first and foremost U.S. Census data synthesized by and accessed via IPUMS USA:
Steven Ruggles, Sarah Flood, Sophia Foster, Ronald Goeken, Jose Pacas, Megan Schouweiler and Matthew Sobek. IPUMS USA: Version 11.0 [dataset]. Minneapolis, MN: IPUMS, 2021. https://doi.org/10.18128/D010.V11.0
In addition, the HOPE Tool incorporates data from the following sources:
HUD data on Area Median Income (AMI)
Zillow data on local home values and rents (ZHVI & ZORI)
ONet job zone ratings for different occupations
Data on occupations’ correspondence to work-from-home propensity and physical proximity requirements from Mongey, Simon, Laura Pilossoph, and Alex Weinberg. “Which workers bear the burden of social distancing policies?” No. w27085. National Bureau of Economic Research, 2020.
-
Full citation: Issi Romem. HOPE Tool, California: Version 1.0 [dataset]. Walnut Creek, CA: MetroSight, 2021. https//www.metrosight.com/hope-tool.
Brief citation: HOPE Tool, MetroSight, https://www.metrosight.com/hope-tool.
-
For inquiries, please contact hope.tool@metrosight.com.
Modifications or customizations may require a fee.
-
MetroSight would like to thank Alex Schafran for his role in envisioning and driving forward the HOPE Tool. We would also like to thank Jacob Adiarte, Jeffrey Buchanan, Sara Hinkley, Elizabeth Kneebone, and especially Scott Littlehale for advising during the development process. Finally, we would like to thank Patrick Atwater, Anthony Dedousis, Michael Lens, Bill Lester, Michael Manville, Paavo Monkkonen, Dan Rinzler, Lindsay Rosenfeld and Oscar Wei for providing helpful feedback. All remaining errors are our own.

2000:
California (16.9MB)
Broad regions (76.8MB)
Narrow regions (107.9MB)
CSAs (66.8MB)
CBSAs (134.6MB)
Counties (173.2MB)
State Senate Districts (371.9MB)
State Assembly Districts (590.8MB)
Cities (384.2MB)
2006-2010:
California (17.4MB)
Broad regions (79.8MB)
Narrow regions (112.5MB)
CSAs (70.3MB)
CBSAs (142.6MB)
Counties (183.4MB)
State Senate Districts (383.9MB)
State Assembly Districts (608.5MB)
Cities (420.6MB)
2015-2019:
California (17.6MB)
Broad regions (79.4MB)
Narrow regions (112.7MB)
CSAs (70.2MB)
CBSAs (141.4MB)
Counties (184.6MB)
State Senate Districts (392.3MB)
State Assembly Districts (635.0MB)
Cities (464.6MB)
Crowdsourced data downloads for non-technical users (Excel):
Users of the HOPE Tool are invited to share back with the public any derived data sets they produce, and in particular any maps or files that may be helpful to non-technical users. Here are some initial such files and projects: