The growing prevalence of LONG-DISTANCE work
Image: John-Mark_Kuznietsov via Freerangestock.com
This content was first published by the ADP Research Institute on Nov 8th, 2023.
While hybrid work tensions are getting a lot of attention these days, it is fully remote work that is likely to have greater implications for the economy and its geography in the long run. Although hybrid work reduces the importance of proximity to the workplace and raises tolerance for long commutes, it still requires people to live within commuting range of their workplace.
Fully remote work, on the other hand, requires no such proximity. And what railroads, the shipping container, and globalization did to goods and capital years ago, it can now do to labor. Fully remote work expands the employer labor pool exponentially, offering the promise of cost-cutting and finding perfectly matched talent. It similarly broadens workers’ horizons with respect to their employment opportunities, what they can earn, and where they can live.
Of course, not all the news is good. Fully remote work threatens smaller or regional employers by giving distant, deep-pocketed rivals an opportunity to skim the cream off the crop of local labor. And it exposes workers to a vast pool of distant competition.
While it’s straightforward to observe where fully remote work is being performed, that is, where remote workers live, it’s not clear how to determine where the remotely filled jobs themselves are located, even conceptually. When an on-site job goes remote, the employee’s former desk pinpoints the job’s location, but what if a newly created job is remote? Is the job located at the employer’s site closest to the worker hired? Wherever HR determines? Or perhaps where a worker’s in-person teammates are located, assuming they’re not all remote themselves.
Fortunately, the point is moot. The grand implications of remote work for the economy and its geography do not depend on where the remotely filled jobs are, but on what extent people who live in quite different places are able to work together. What matters is that people work together from different places, regardless of whether the work is done from home, the office, or somewhere else. Moving functions to a back office in a place with cheaper wages was possible well before Zoom, but remote work greatly expands the range of possibilities.
ADP data to the rescue
Collaborating on work from different places is nothing new, but the normalization of remote work during the Covid-19 pandemic has helped take the phenomenon to a whole new level, a shift that ADP data is uniquely well positioned to study. The crucial ingredient for studying the geographic layout of work collaboration is not observing whether an employee spends their days at home or at an office, but rather who works with whom, and where in the nation they are located. We are able to make these observations using ADP data on reporting structures within large firms.[1]
We define teams as groups of employees with a common manager, and we observe whether these workers are all located in the same metropolitan area or distributed across two or more metros.[2] When a worker lives in a different metro area than their manager, we refer to them as a cross-metro worker, and to the work they do as cross-metro work.
This article is the first in a series exploring cross-metropolitan work and putting numbers to it, beginning with its prevalence.
The prevalence of cross-metro work
Prior to the pandemic, the prevalence of cross-metro work was edging up slowly; since then, it has been skyrocketing. As shown in Figure 1, among employees at large firms whose reporting structure is observed, the share of cross-metro workers rose from about 21.9 percent to 22.9 percent from the beginning of 2016 to the pandemic “eve” in February 2020. Since then, it jumped to 31.2 percent as of June 2023.
Figure 1
For employees on distributed teams, which include all members of teams having at least one cross-metro worker, the share of cross-metro workers rose from about 41.4 percent to 42.5 percent over the four years leading up to the pandemic and reached 52.3 percent in June 2023.
Although there is significant overlap between remote work and cross-metro work, the concepts are inherently different, and that distinction helps us understand what we see in the data.
Someone working remotely, for example, from home but in the same metro area as their manager, is performing remote work that is not cross-metro. In that sense, cross-metro work captures less than the full extent of remote work. On the other hand, someone working from an office—or any other work establishment—while reporting to a manager located in a different metro area is performing cross-metro work that is not remote. Workers at a satellite office reporting to a manager at headquarters could fall in this category, for example, as could a local store or factory manager reporting into the regional center. So, in this sense, cross-metro is broader than remote work.
Therefore, it comes as no surprise that the pandemic-driven acceleration in the growth of cross-metro work shows up in almost every industry, from ones that seem remote-friendly, such as finance and insurance or information, to those that do not, such as manufacturing.[3] Similarly, the pandemic-driven acceleration shows up clearly among both workers whose jobs do not require proximity to others, and those whose jobs do.[4]
The demographics of cross-metro workers
In addition to accelerating the growth of cross-metro work, the pandemic also transformed the demographics of those engaged in cross-metro work. Comparing the earnings of cross-metro workers to those of their teammates’ offers a hint of the changes.
Until the pandemic, the wages of cross-metro workers were approximately 1.1 percent higher on average than those of their teammates, i.e., their co-workers who report to the same manager. But as shown in Figure 2, that premium has fallen to just 0.4 percent as of June 2023, converging to near parity.
Figure 2
How is the decline in the cross-metro worker wage premium related to demographics? Before the pandemic, cross-metro workers tended to skew older. Since then, their ranks have seen an influx of younger workers, bringing the group’s composition and average pay closer to that of their same-metro colleagues.
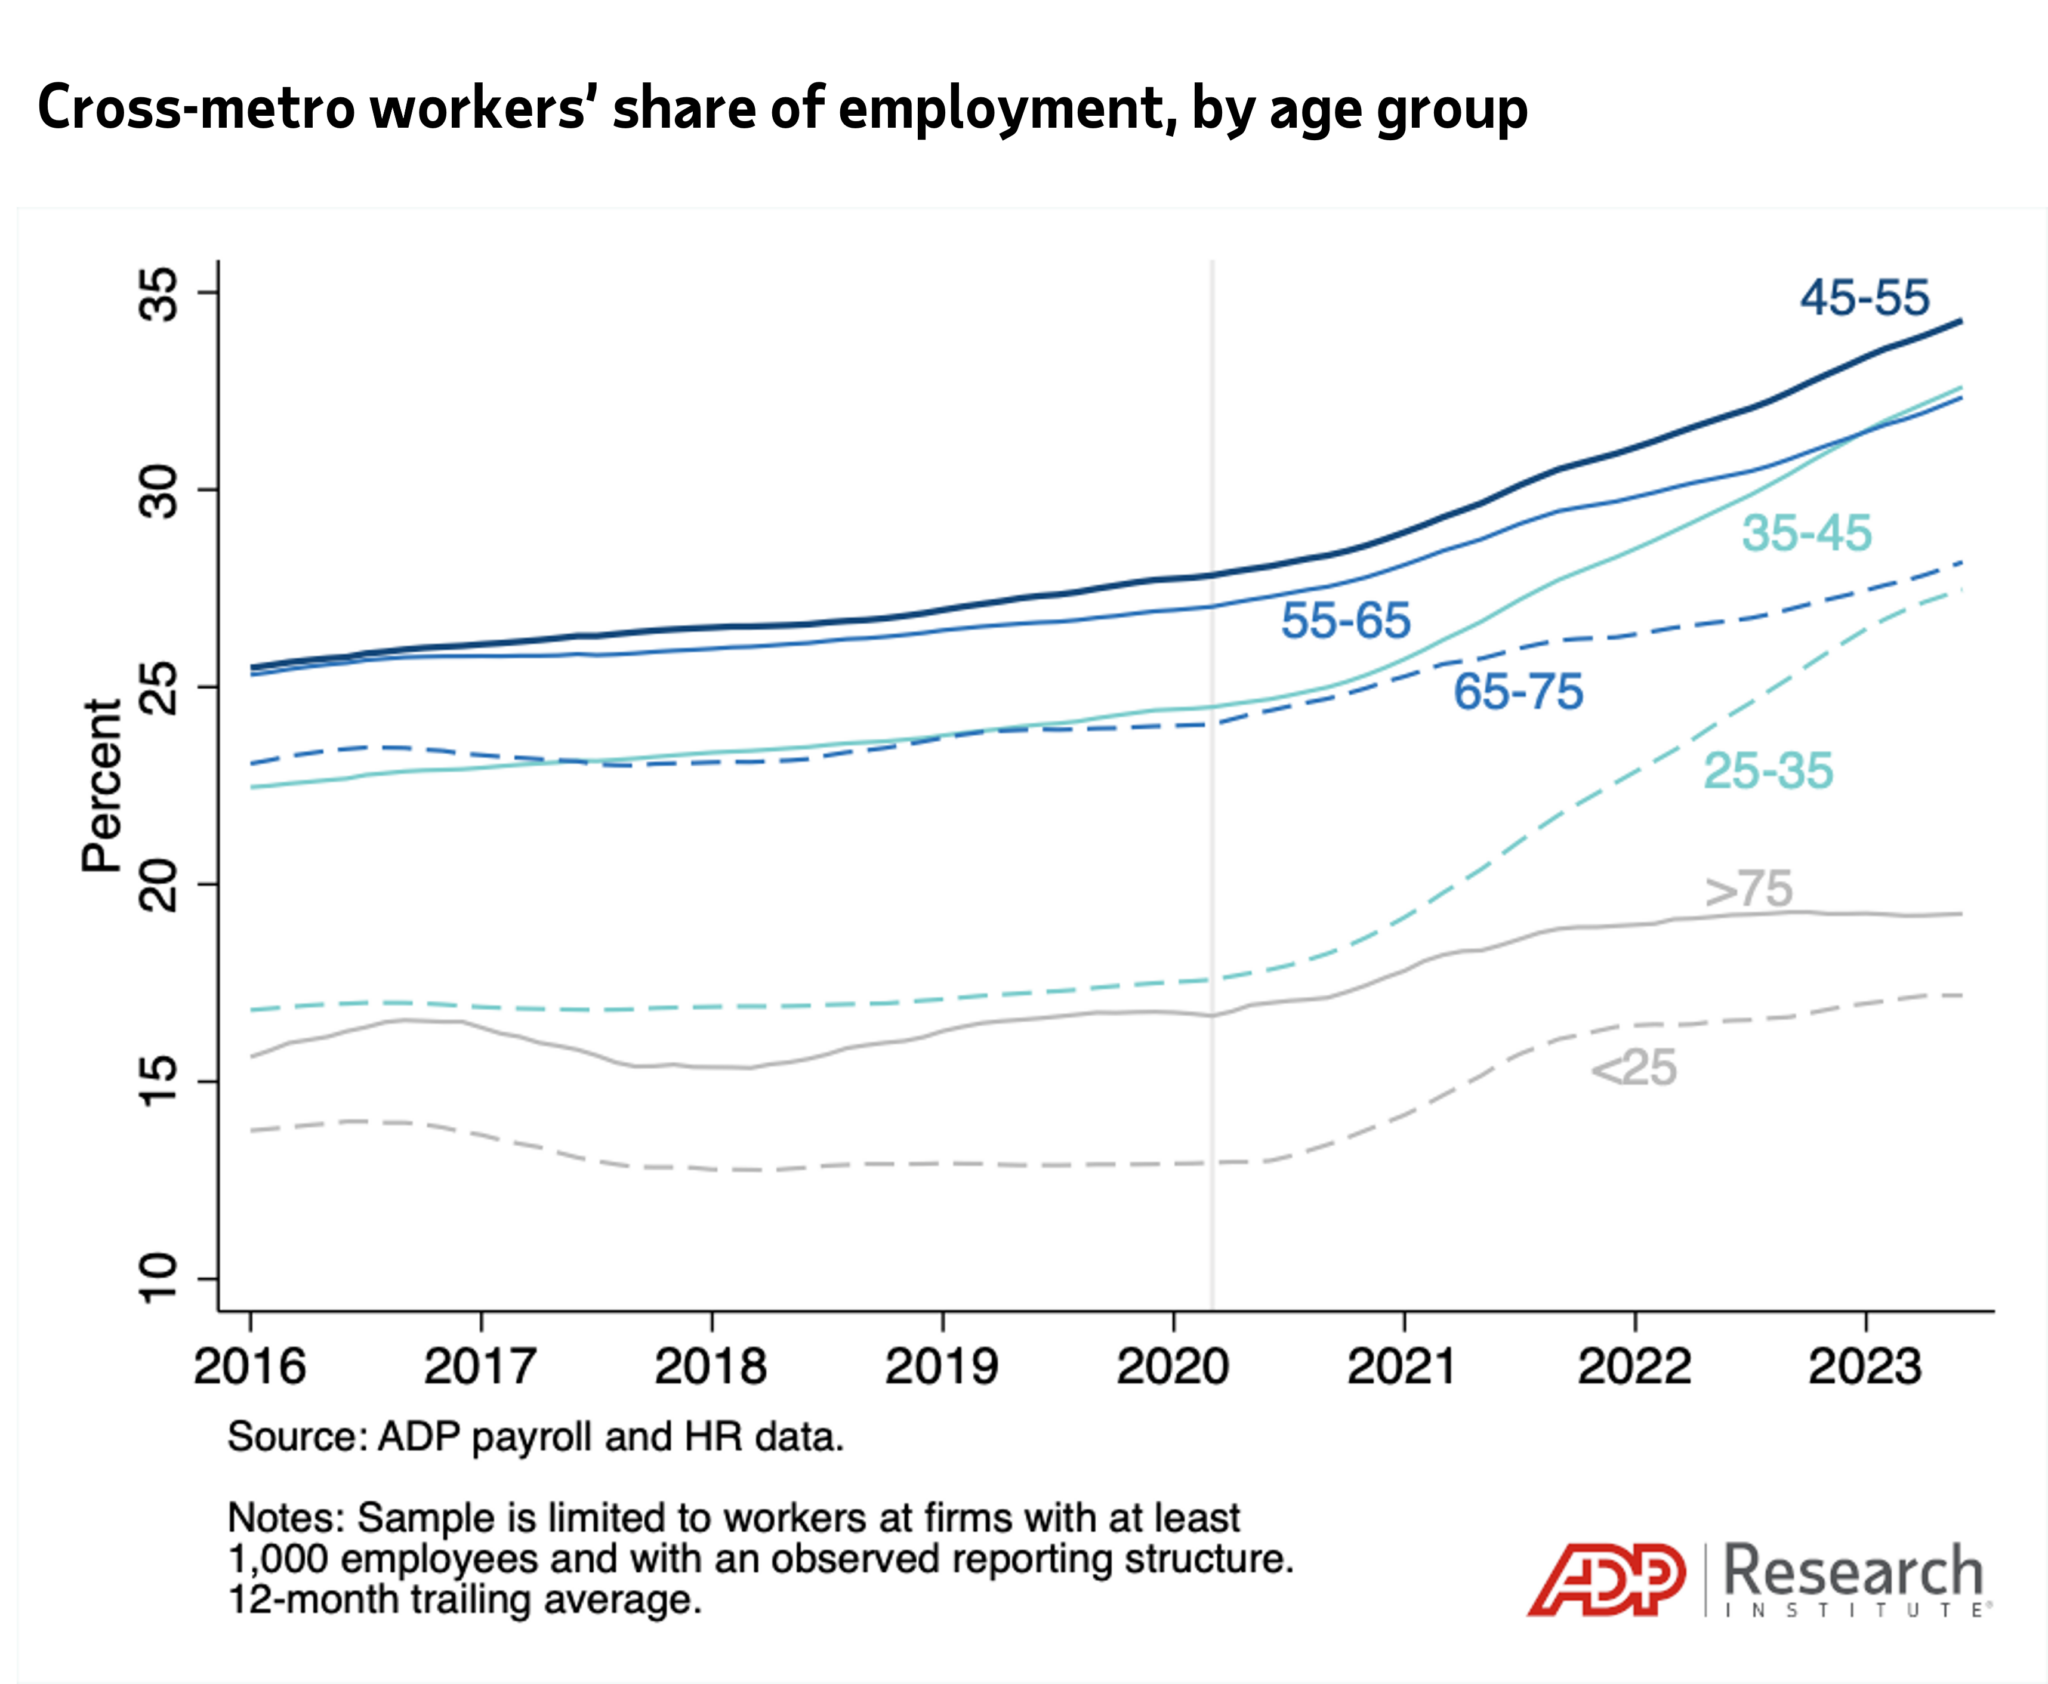
Figure 3 presents the share of cross-metro workers within each age group. The biggest share is found among 45- to 55-year-olds, followed by the 55-65 and 35-45 age groups. Those older than 75 or younger than 25 have the lowest shares working cross-metro.
Figure 3
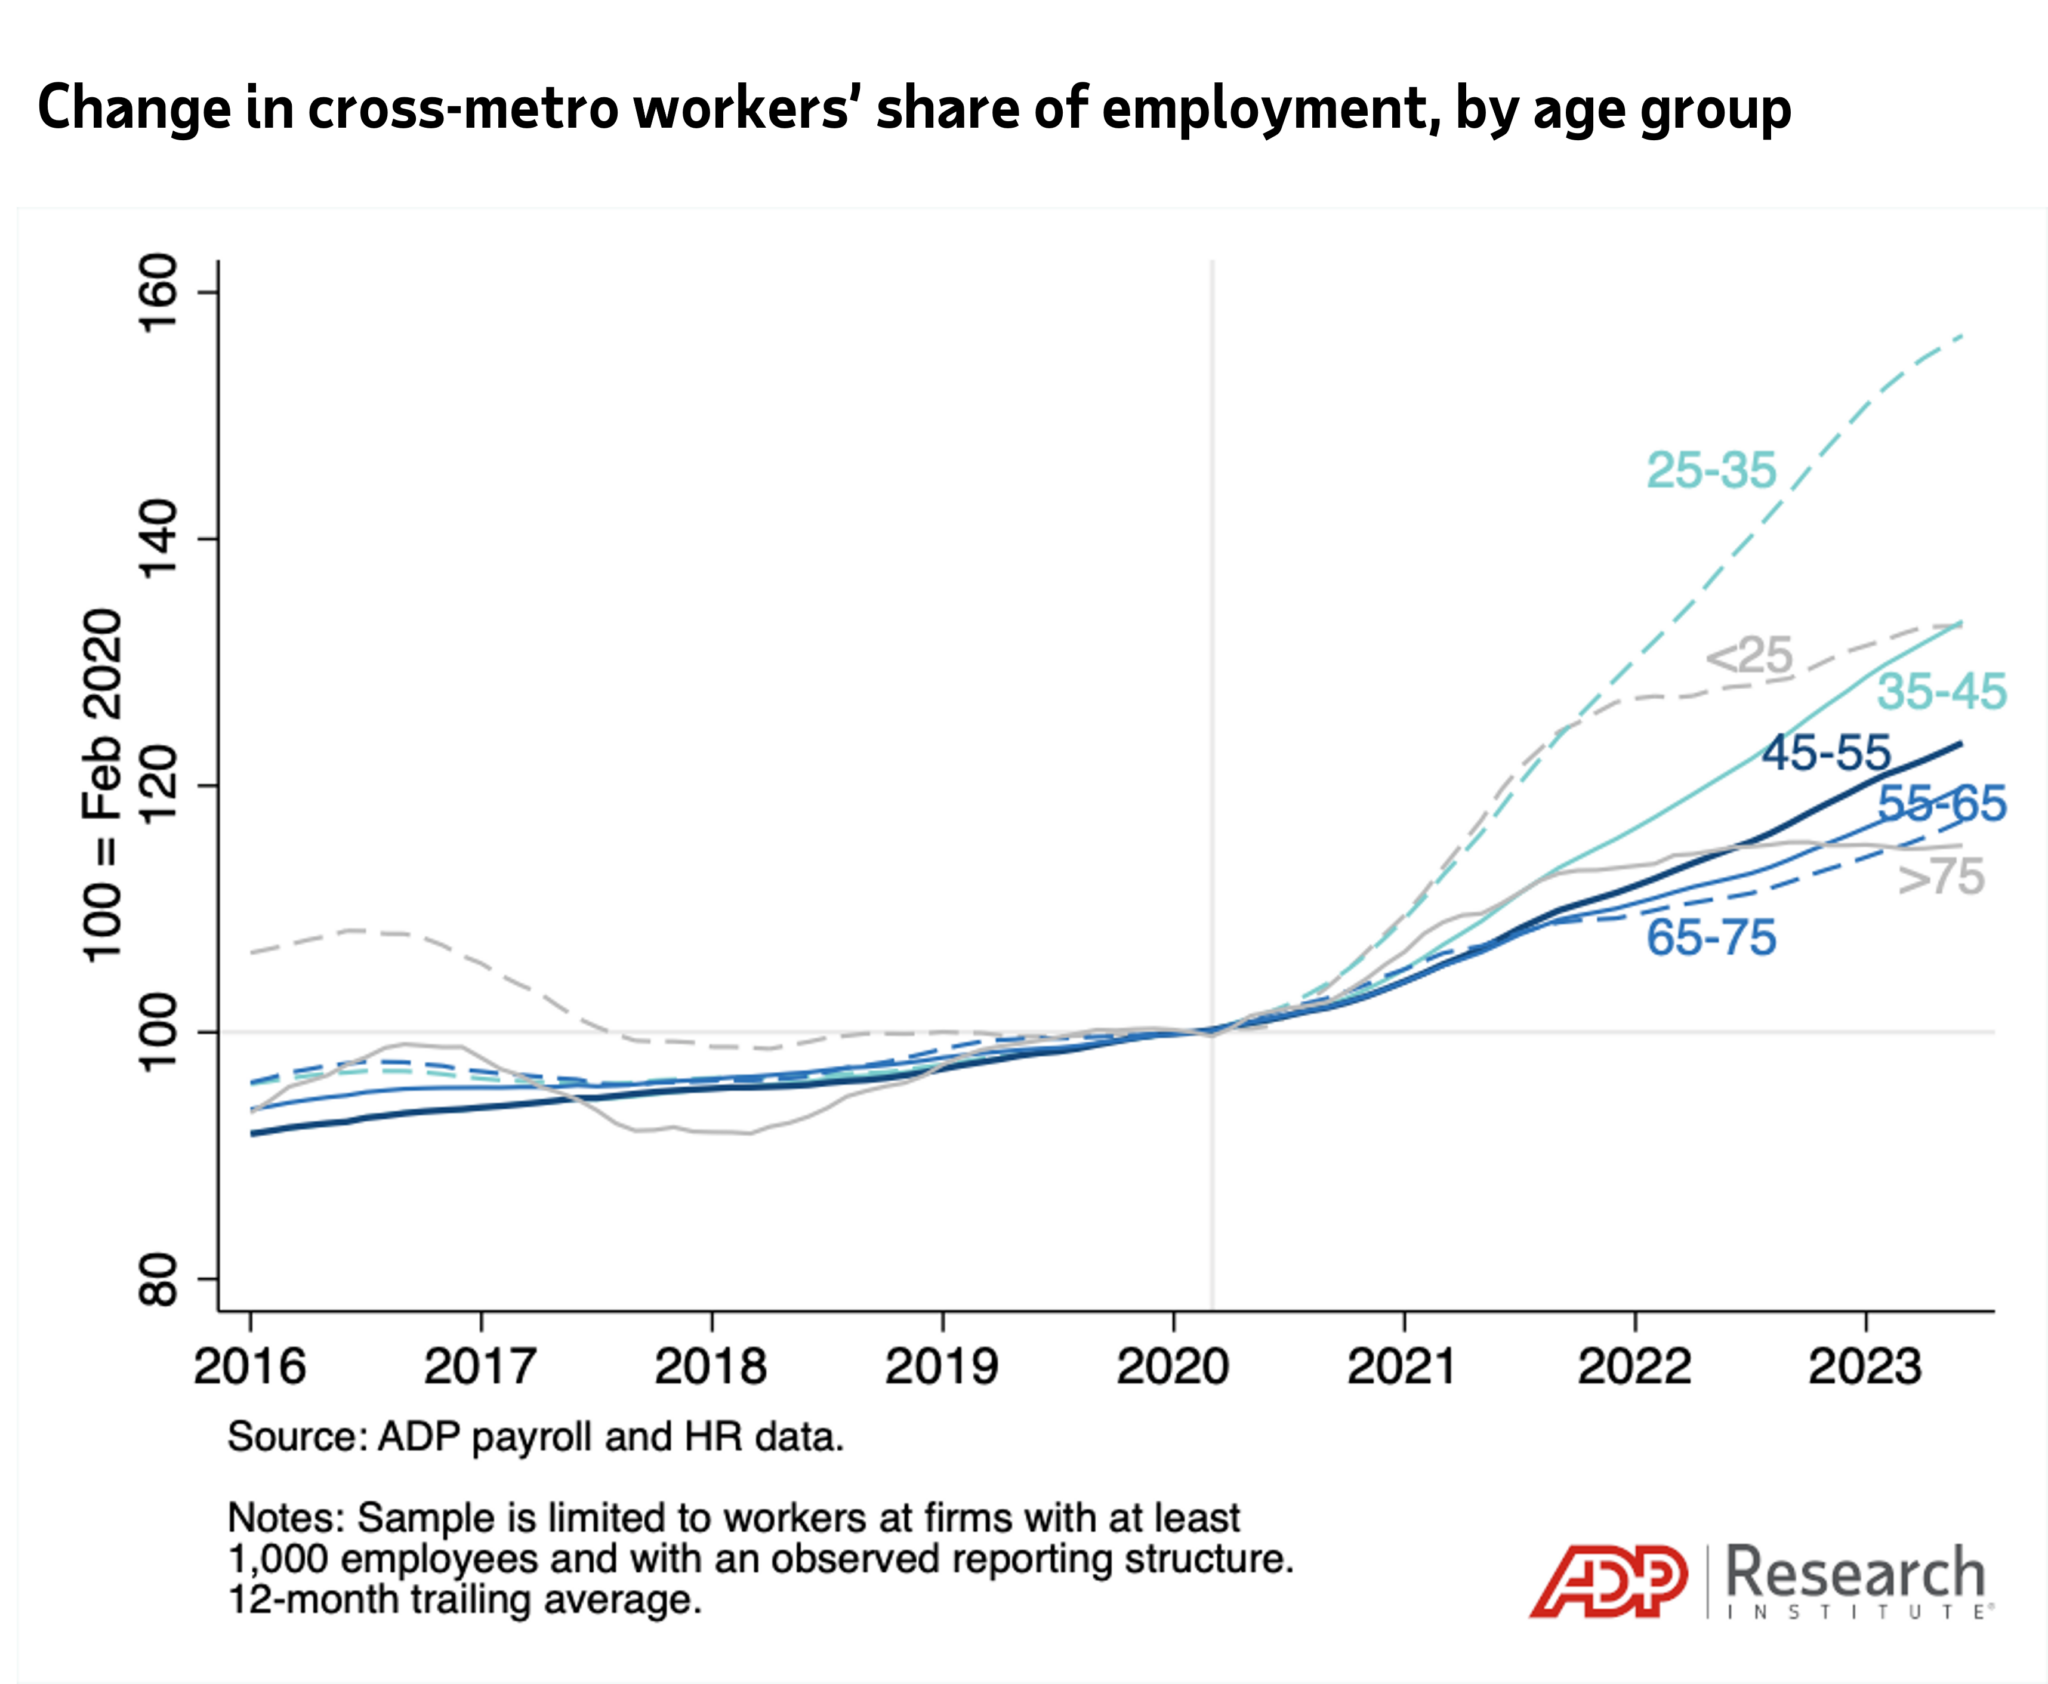
But that has changed since the pandemic. Figure 4 normalizes the share of cross-metro workers in each age group to a level of 100 on the eve of the pandemic—February 2020—which helps illustrate the growth since then. The 25-35 age group has seen the greatest increase in its cross-metro share. The younger than 25 and 35-45 age groups have seen substantial growth as well.
Figure 4
Indeed, while about 47.8 percent of cross-metro workers were 45 or younger before the pandemic, their share had grown to 53.8 percent by June 2023. In contrast, average pay levels within each of the age groups have essentially remained flat, as shown in Figure 5. The age groups most prevalent among cross-metro workers before the pandemic are, in fact, higher paid on average than the younger workers who have been joining their ranks.
Figure 5
In summary, the pandemic has greatly accelerated the growth of cross-metro work, making it significantly more prevalent than before. It also has changed the composition of cross-metro workers by drawing in more younger workers.
Of course, none of this speaks to the grand implications of cross-metro work for the economy or its geography yet. For more on that, tune in to the next article.
Notes:
The sample used consists of a subset of employers in ADP data with at least 1,000 employees in the U.S. Within those firms, the sample was further limited to members of teams with a reliable set of reporting structure fields, as captured by limiting the data to teams in the U.S. in which no more than 10 employees report to the same manager. Although the number varies over time, there are approximately 1.33 million employees that meet these criteria each month on average from January 2016 to June 2023, employed by an average of 3,500 firms each month.
Metropolitan areas refer to Consolidated Statistical Areas (CSAs) where applicable and Core-Based Statistical Areas (CBSAs) elsewhere. By using the broadest available definitions of metropolitan areas, we minimize situations in which workers separated by arbitrary lines within broader metros, e.g. between the San Francisco and San Jose metro areas, are considered cross-metro.
The share of cross-metro workers in the finance and insurance industry increased from about 18.4 to 21.9 percent from January 2016 to February 2020, and then to 31.1 percent by June 2023. The corresponding figures in the information sector, were 21.3 and 29.0 percent in January 2016 and February 2020, and 43.7 percent in June 2023, indicating much faster growth both before and after the onset of the pandemic. In the manufacturing sector, the share of cross-metro workers increased from about 25.1 to 26.1 percent from January 2016 to February 2020, and then to 31.4 percent by June 2023.
Using data on employees’ occupations that is readily available from January 2017, workers were assigned into high- and low-proximity categories based on their occupations’ O*NET scores. A value of 50 was used as the threshold, splitting the 0-100 range in the middle. The share of cross-metro workers in the low-proximity category increased from about 27.2 to 28.6 percent from January 2017 to February 2020, and then to 38.4 percent by June 2023. Although the corresponding figures for the high-proximity group were lower and increased by less after the onset of the pandemic, they exhibit the same general pattern, edging up slowly from about 19.4 to 19.7 percent from January 2017 to February 2020, and then rising more sharply to 23.6 percent by June 2023.


